Customer guides
How to use TruCount Pro
Start with your dashboard, find a sensor, and follow a reading through to an incident. Customer administrators use the Company role. Day-to-day operators and viewers use the User role.
Your organisation’s permissions, site assignments and enabled modules determine which menus and actions you see.
Screenshots are from test sessions signed in as a Company administrator or User. Menu items and controls vary by role and enabled features.
User & Company
Monitor sensors and report on readings
Start with the dashboard
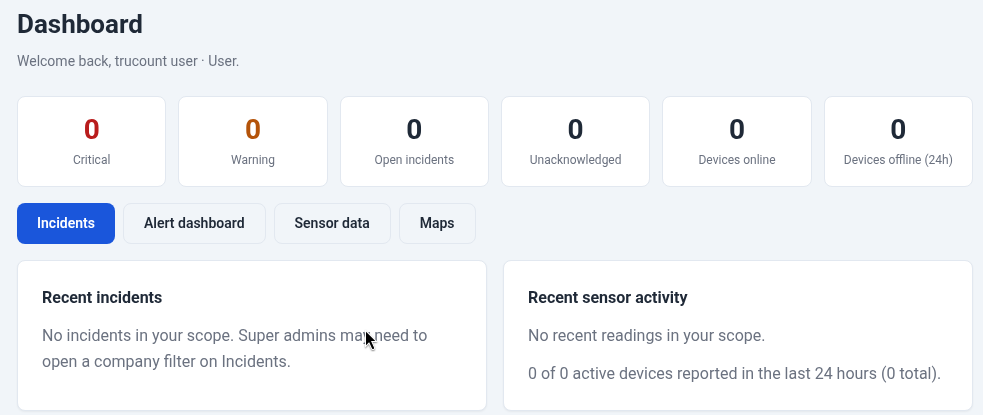
Sign in and open Dashboard. Check the warning and critical counts, open incidents and recent sensor activity. Use the shortcuts to open the relevant list. If you expected to see a site or sensor, check your filters and ask your Company administrator to confirm your site access.
Find a sensor and check its readings
- Open Sensors and select a device. Check its name, location and status so you know you have the right sensor. If you have access to Device Groups, you can see how similar devices are grouped.
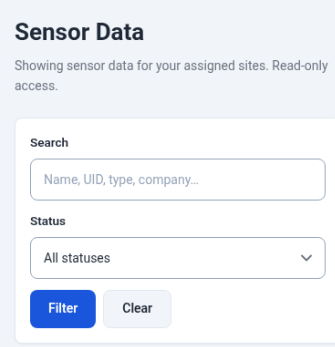
- Open Sensor Data. Use the search and site filters available to you, then open the sensor’s history.
- Choose a time window. Check the reading’s timestamp, measurement and unit before comparing it with another sensor or an alert threshold.
- Use the chart, where available, to spot trends or gaps. Check the history table for individual readings. Use Export CSV if you need to share the filtered readings and your role allows it.
If the latest reading looks stale, widen the date range and check the last reporting time. Record the sensor name, site and expected reporting interval before escalating.
Use maps and reports
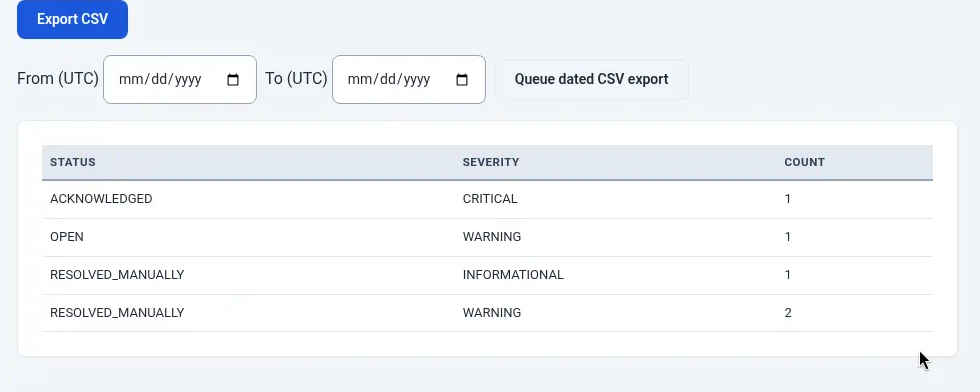
Open Maps to locate sites and devices with mapped positions. For summaries, use Reports and select the available scope and date range. To review counts by incident status and severity, use Alerts → Alert Reports.
User & Company
Review alerts and respond to incidents
Alert States shows a rule’s current condition. Alert History shows earlier events. Incidents is where you track the investigation and response.
- From Alert Dashboard, open the incidents list and find the relevant site, sensor or severity. Start with critical or unacknowledged incidents.
- Open the incident and review its summary and timeline. Compare the trigger time with the sensor’s reading history. For a no-data alert, check the last reading and the expected reporting interval.
- If your role allows it, acknowledge the incident to record that someone is responding. Assign an owner when follow-up is needed.
- Add a note with what you checked and what action you took. Resolve the incident when the investigation is complete and your procedure allows it. If you have viewing access only, pass the incident reference to your administrator.
If an incident did not send the expected notification, check active maintenance or suppressions, recipient verification and the escalation policy that applies.
Company · With alert permissions
Set up alerts for your sites
Create and check a rule
- Find a recent reading in Sensor Data and note the parameter and unit. Decide whether the rule should cover one sensor, a site, or a wider scope available to your role.
- Open Alerts → Alert Rules → Create rule. Give it a name that identifies what the team should investigate, such as Cold room high temperature.
- Choose the category and operator. Enter warning and critical limits where supported. Use a no-data rule for missing readings and a battery rule where the device reports a battery value.
- Choose whether to confirm immediately, after a duration, or after consecutive readings. Set recovery conditions where available so the rule can return to normal when the reading settles.
- Check the assigned sensors or sites. Simulate the rule if the option is available, then enable it when ready. Use Alert States and any available evaluation history to check how readings are classified.
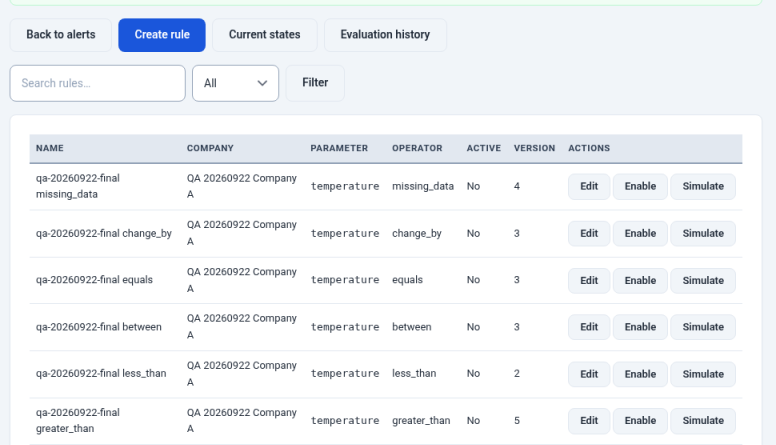
For example, you could configure a high-temperature rule for one cold-room sensor and require several consecutive high readings before it opens an incident. Choose the limit, confirmation period and recovery settings for your own equipment and operating procedure.
Set up notifications and escalation
- Open Contacts, add the intended recipients and ask them to verify their email destinations.
- Review which severities should notify each recipient. Under Escalation, configure who gets the next notification and when, where available.
- Check the policy scope and recipients before relying on it for an operational response.
Schedule maintenance or silence a known alert
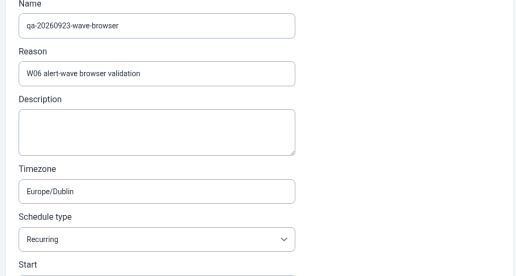
Open Maintenance before planned work. Name the window, choose the relevant scope, check the time zone and set its start and end. Review the notification options before saving. Use Suppressions for temporary silencing where permitted, recording the reason and expiry.
Company
Manage customer access and settings
Invite a colleague and check site access
- Open Users and choose the invite action if available. Enter the colleague’s work email and choose the role they need.
- Assign their permitted sites where your role and deployment allow. Use Roles & Permissions to review available actions.
- After they accept, ask them to check that the expected sites appear in Sensor Data. If a site is missing, review their role and assignments before changing anything else.
Review activity and account settings
Use Audit Log to investigate changes within your organisation. Start with the date range, then narrow by actor or action where those filters are offered. Use Notifications and System Settings to review the options available to your company.
If enabled, Account Setup guides you through initial setup, Billing shows subscription or invoice information, and API Keys manages integration access. Keep keys private and use the signed-in documentation for sensor submission formats.
User & Company
Manage your account and get help
Update your profile or password
Open the account menu and choose My Account to review your profile. Use Change Password when signed in, or the password reset option on the sign-in screen if you cannot access your account.
Set up two-factor authentication
- Open Security from the account menu and follow the authenticator setup prompts.
- Scan the setup code in your authenticator app and enter the current verification code to complete setup.
- Keep any recovery codes somewhere secure. If you lose access to your authenticator, use an unused recovery code or contact your administrator or support.
Get help with a specific issue
Open Help or Documentation in the console for guidance matched to your role. When contacting support, include the site, sensor name, date and time with time zone, and incident reference if relevant. Leave passwords, API keys and recovery codes out of your message.
Use Privacy & Data for the privacy options available to your account. Choose Logout when you finish on a shared computer.
Open full documentation in the console ↗